
Future Demand for Lithium in Electric Vehicles
There is a geological element sitting at the centre of the most consequential industrial transformation of the twenty-first century. It is the lightest solid element on the periodic table — so light it floats on water, so reactive it must be stored under oil to prevent it igniting on contact with moisture in the air. It is found in hard-rock pegmatite mines deep in the highlands of Zimbabwe, Nigeria, and Western Australia; in salt flat brines shimmering under the brutal sun of the Atacama Desert in Chile and Argentina; and in clay deposits under the Nevada desert and the Tibetan plateau. It has a long history of modest industrial uses — ceramics, glass, lubricants, psychiatric medication — that did nothing to prepare the world for what it is now being asked to do. It is lithium, and the electric vehicle industry’s demand for it is about to change the mining world permanently.
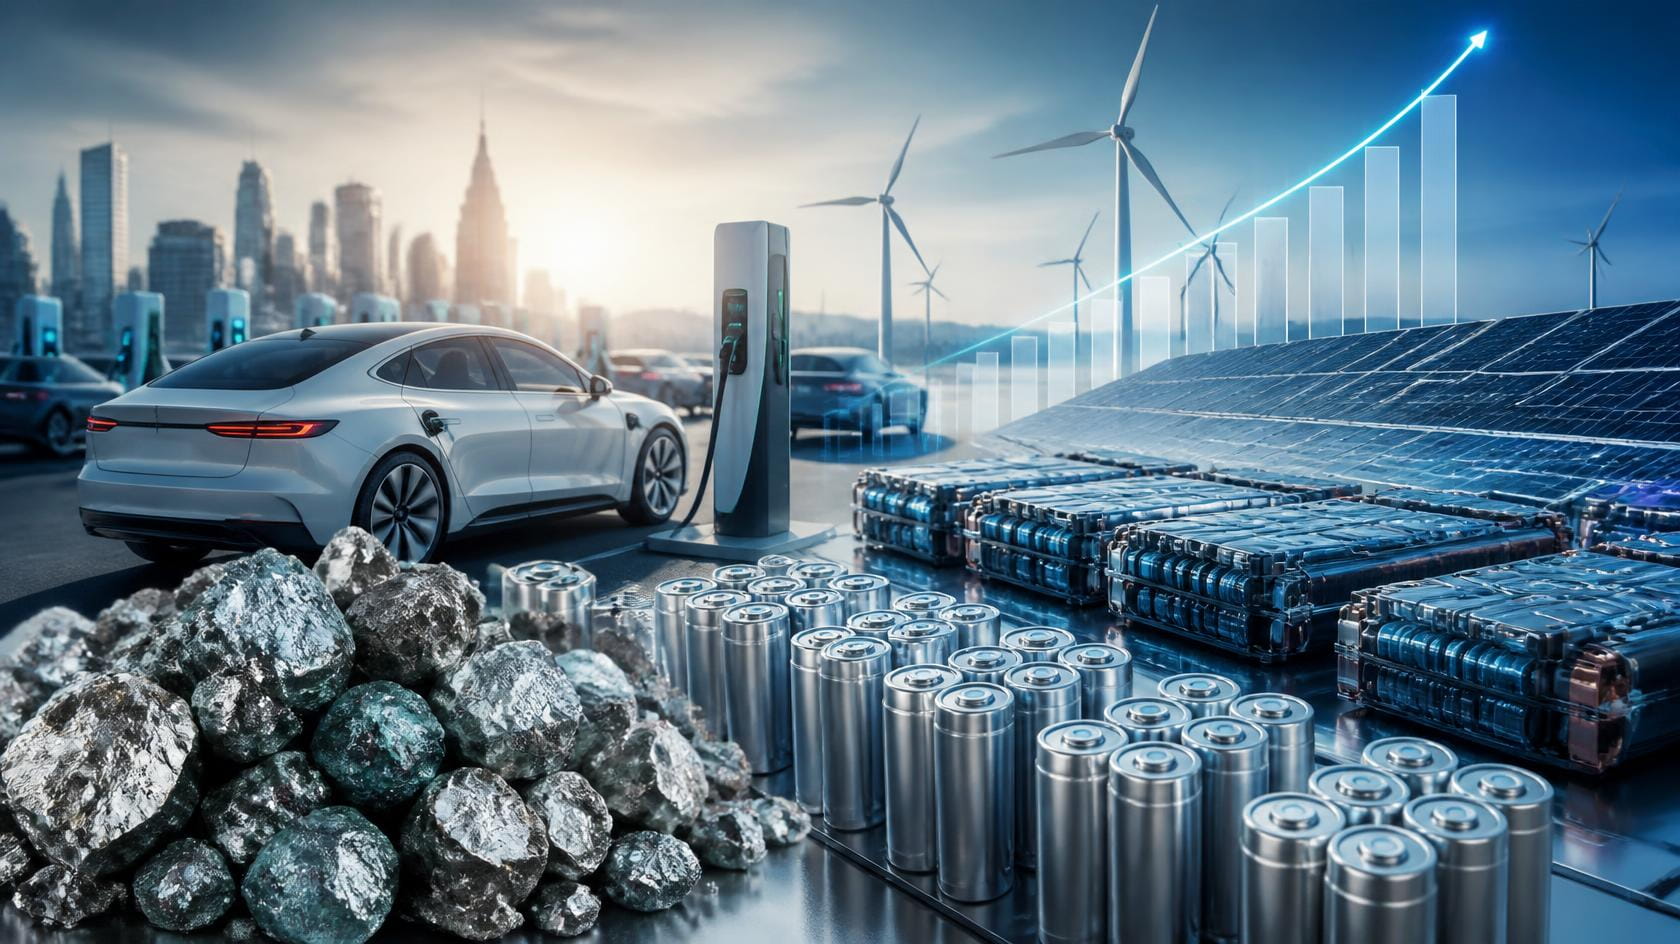
The future demand for lithium in electric vehicles is not a speculative question. The policy decisions have been made, the manufacturing investments have been committed, and the consumer adoption curves are past the inflection point in every major economy. The world is electrifying its passenger vehicle fleet, and the lithium-ion battery is the technology platform on which that electrification is being built. What remains uncertain is not whether lithium demand will surge — it will, dramatically and irreversibly — but whether lithium supply can keep pace with demand, on what timeline, from which geographies, and at what price and social cost.
This article is a comprehensive examination of the future demand for lithium in electric vehicles — covering the electrochemistry of why lithium is the chosen element, the different battery chemistries and their lithium requirements, the current and projected scale of EV adoption, the supply-demand balance and its implications, the geographic distribution of lithium supply including Africa’s and Nigeria’s growing role, the technology wild cards that could reshape the picture, and the policy drivers that are accelerating the transition beyond what the market alone would achieve. It is written to be genuinely useful to the mining and export professional, the international commodity buyer, the policy analyst, and any informed reader who wants to understand what is arguably the most important mineral demand story of our generation.
Why Lithium? — The Electrochemical Reasons This Element Powers the EV Revolution
Battery chemistry is not arbitrary — the choice of lithium as the active element in the dominant rechargeable battery technology is the result of fundamental electrochemical physics that makes lithium uniquely suited to the energy storage requirements of electric vehicles. Understanding why lithium is the chosen element — rather than sodium, potassium, magnesium, zinc, or any other element — is the starting point for understanding why lithium demand is inextricably tied to the EV revolution.
① Lowest Atomic Mass of Any Metal: Lithium (atomic mass 6.94 g/mol) is the lightest of all solid elements and the lightest of all metals. In a battery, the energy density (energy stored per kilogram of battery weight) is fundamentally limited by the atomic mass of the active elements — lighter atoms can carry charge more efficiently per unit of mass. Lithium’s extraordinarily low atomic mass gives lithium-ion batteries a theoretical specific energy advantage that no heavier-element battery chemistry can match.
② Highest Electrochemical Potential: Lithium has the most negative standard reduction potential of any element (−3.04 V vs. standard hydrogen electrode), meaning lithium-based electrodes can generate a higher cell voltage than any other metal-based electrochemical system. Higher voltage means more energy delivered per unit of charge — and since energy equals voltage multiplied by charge (E = V × Q), higher voltage directly translates into higher energy density. A typical lithium-ion cell operates at 3.6–3.7 V nominal, compared to 1.2 V for nickel-metal hydride (NiMH) and 2.0 V for lead-acid — giving lithium-ion an inherent energy density advantage that is embedded in the fundamental electrochemistry.
③ Excellent Ion Mobility: Lithium ions (Li⁺) are small and highly mobile — they diffuse readily through both liquid electrolytes and solid electrode materials, enabling fast charging rates without irreversible electrode damage. This high ionic mobility is essential for automotive applications where rapid charging (0%–80% in 15–30 minutes for current fast chargers) is a customer expectation.
④ Long Cycle Life in Intercalation Electrodes: When lithium ions are intercalated (inserted into the crystal structure) of graphite anodes and layered oxide cathodes — rather than undergoing metallic deposition — the electrode materials experience minimal volumetric change and structural degradation during charge-discharge cycling. This intercalation chemistry gives lithium-ion batteries cycle lives of 500–3,000+ cycles (depending on chemistry and depth of discharge) — adequate for 8–15+ years of automotive use.
⑤ No Competing Technology at Automotive Scale: Sodium-ion (Na-ion), magnesium-ion, zinc-air, and other alternative chemistries all face fundamental electrochemical disadvantages — lower voltage, lower energy density, lower cycle life, or lower ionic mobility — that have prevented them from displacing lithium-ion at the automotive scale despite decades of research. Lithium-ion’s dominance is not merely inertia — it is based on inherent electrochemical advantages that are difficult or impossible to replicate with other elements.
EV Battery Chemistries and Their Lithium Intensity
Not all lithium-ion batteries are the same — and not all of them require the same amount of lithium per kilowatt-hour of energy stored. The choice of cathode chemistry is the primary determinant of lithium intensity in an EV battery pack, and understanding the differences between the major cathode chemistries is essential for projecting how lithium demand will evolve as the EV market grows and as the mix of battery chemistries shifts.
| Chemistry | Full Name | Li Content (kg/kWh) | Energy Density | Key Users |
|---|---|---|---|---|
| NMC 811 | Nickel Manganese Cobalt (80:10:10) | ~0.85 kg/kWh | Very high (~250 Wh/kg) | BMW, GM, SK Innovation, Samsung SDI |
| NMC 622 | Nickel Manganese Cobalt (60:20:20) | ~0.95 kg/kWh | High (~220 Wh/kg) | LG Energy Solution, Volkswagen, Renault |
| NCA | Nickel Cobalt Aluminium | ~0.80 kg/kWh | Very high (~260 Wh/kg) | Tesla (Panasonic cells), Panasonic |
| LFP | Lithium Iron Phosphate | ~1.10–1.30 kg/kWh | Moderate (~160 Wh/kg) | BYD, Tesla (standard range), CATL, most Chinese EVs |
| LMFP | Lithium Manganese Iron Phosphate | ~1.10 kg/kWh | Moderate-high (~180 Wh/kg) | CATL (emerging), BYD (next gen) |
| All-Solid-State (projection) | Various; lithium metal anode | ~0.60–0.75 kg/kWh (est.) | Ultra-high (>350 Wh/kg projected) | Toyota, Samsung SDI, QuantumScape (2027–2030 target) |
A critical — and often misunderstood — point in the battery chemistry landscape is that the shift toward LFP (lithium iron phosphate) chemistry, which has accelerated dramatically since 2021 driven by Chinese manufacturers’ cost optimisation, actually increases lithium demand per kWh rather than reducing it. LFP batteries contain 20%–50% more lithium per kilowatt-hour than NMC or NCA chemistries, because the iron phosphate cathode has a lower specific capacity per gram than nickel-rich oxide cathodes, requiring more lithium to be cycled per unit of energy stored. The widespread narrative that “LFP reduces lithium demand” is partially incorrect — LFP reduces cobalt demand and nickel demand, but it intensifies lithium demand per vehicle. This is an important consideration for anyone projecting future lithium supply requirements from the current EV chemistry mix.
How Much Lithium Goes Into an Electric Vehicle?
The lithium content of an individual EV battery pack varies considerably depending on the vehicle’s battery capacity (kWh), the cathode chemistry used, and the anode design. The following figures give a realistic range of lithium content for different EV segment types, expressed both in terms of lithium metal content and in terms of the lithium carbonate equivalent (LCE) that the lithium mining industry uses as its standard unit of measure.
| Vehicle Type | Typical Battery (kWh) | Lithium Metal (kg) | LCE (kg) |
|---|---|---|---|
| City/Compact EV (e.g., Wuling Mini EV) | 10–20 kWh | ~0.9–1.8 kg Li | ~5–10 kg LCE |
| Mid-size EV sedan (e.g., Tesla Model 3 SR) | 55–60 kWh | ~5.5–7 kg Li | ~30–38 kg LCE |
| Large EV (e.g., Tesla Model S, BMW iX) | 95–110 kWh | ~8–12 kg Li | ~44–66 kg LCE |
| Electric SUV / Pickup (e.g., Rivian R1T, F-150 Lightning) | 130–180 kWh | ~12–18 kg Li | ~66–100 kg LCE |
| Electric Bus / Commercial Vehicle | 200–600 kWh | ~20–65 kg Li | ~110–360 kg LCE |
Using a representative average of approximately 8 kg of lithium metal (43 kg LCE) per passenger EV — weighted across the current global mix of small city EVs, mid-size sedans, and larger family SUVs — the arithmetic of future lithium demand follows directly from the projected number of EVs sold annually. At 10 million EVs per year, global EV demand for lithium is approximately 430,000 tonnes of LCE. At 50 million EVs per year, it exceeds 2 million tonnes of LCE. At 100 million EVs per year — which is the approximate level of total global passenger vehicle sales today — it approaches 4 million tonnes of LCE per year from passenger vehicles alone, plus substantial additional demand from commercial EVs, grid storage, e-bikes, and other battery applications.
The Current Global EV Market — Understanding the Baseline
Before projecting future demand, it is essential to understand the current state of the global EV market — how many vehicles are being sold, which markets are leading adoption, and what the recent growth trajectory looks like. The numbers are remarkable by any historical measure of industrial transition speed.
① Global EV Sales Growth: Global battery electric vehicle (BEV) and plug-in hybrid electric vehicle (PHEV) sales reached approximately 14 million units in 2023, up from approximately 10 million in 2022, 6.5 million in 2021, and just 3 million in 2020. This consistent doubling or near-doubling of annual sales every one to two years represents one of the fastest adoption curves of any major consumer technology in industrial history. The EV share of global new passenger vehicle sales reached approximately 18% in 2023 and crossed 20% in early 2024 — a threshold that signals the EV transition has moved well past the early adopter phase into mainstream penetration.
② China’s Dominant Position: China accounts for approximately 60% of global EV sales — driven by a combination of aggressive government subsidies and mandates (New Energy Vehicle credits), a highly competitive domestic manufacturing industry (BYD, CATL, SAIC, NIO, Li Auto), and a consumer market increasingly comfortable with and enthusiastic about electric vehicles. China’s EV penetration rate in new car sales exceeded 35% in 2023 and is on track to exceed 50% by 2025–2026 in several major cities.
③ Europe’s Policy-Driven Transition: The EU’s 2035 ICE phase-out — banning the sale of new internal combustion engine passenger cars by 2035 — and strong CO₂ emissions regulations have driven rapid EV adoption in major European markets, particularly Norway (over 90% EV share), Netherlands, Sweden, Germany, and France. Europe’s EV share of new car sales was approximately 22% in 2023, driven primarily by BEVs in Scandinavia and the Benelux, and PHEVs in Germany and France.
④ The United States — Catching Up Under the IRA: US EV adoption has historically lagged China and Europe due to lower fuel prices, larger average vehicle sizes (favouring range-intensive batteries), and less aggressive government mandates. However, the Inflation Reduction Act’s EV tax credits (up to $7,500 per vehicle for qualifying models) and aggressive EV manufacturing commitments from Ford, GM, Stellantis, and all major foreign manufacturers have significantly accelerated the US transition. US BEV sales exceeded 1.2 million in 2023, representing approximately 7.5% of new car sales — still below China and Europe, but growing rapidly.
⑤ Emerging Markets — The Next Wave: India, Southeast Asia (particularly Thailand and Indonesia), Brazil, and Sub-Saharan Africa represent the next wave of EV adoption, currently in the very early stages but with significant long-term volume potential. India’s government has set targets for 30% EV penetration in new vehicle sales by 2030. These markets are currently dominated by two- and three-wheel electric vehicles (e-motorcycles, e-rickshaws, e-tuktuks) rather than passenger cars, but the transition to electric four-wheelers is accelerating as vehicle prices fall.
Future Lithium Demand Projections — What the Forecasters Say
Multiple authoritative bodies — the International Energy Agency (IEA), BloombergNEF, Wood Mackenzie, Benchmark Mineral Intelligence, Fastmarkets, and the USGS — publish lithium demand forecasts that, while varying in their specific numbers, converge on a clear directional conclusion: lithium demand will grow by a factor of four to ten times current levels by 2030–2040, driven primarily by EV battery demand. The following projections are representative of the mainstream analytical consensus as of 2025–2026:
| Year | Total Li Demand (000s t LCE) | EV Share of Demand (%) | Implied EV Sales (mn units) |
|---|---|---|---|
| 2023 (Actual) | ~820,000 t LCE | ~75% | ~14 million |
| 2025 (Forecast) | ~1.1–1.3 million t LCE | ~78% | ~20–22 million |
| 2030 (Forecast) | ~2.5–3.5 million t LCE | ~82% | ~40–55 million |
| 2035 (Forecast) | ~4.5–6.5 million t LCE | ~85% | ~65–80 million |
| 2040 (Forecast) | ~7–10 million t LCE | ~87% | ~80–100 million |
Note: Projections represent mid-case scenarios from aggregated forecasts. Actual figures will vary based on EV adoption rates, battery chemistry evolution, and energy density improvements. LCE = Lithium Carbonate Equivalent (1 kg Li metal = 5.323 kg LCE).
These numbers tell a story of extraordinary magnitude. Global lithium production in 2023 was approximately 180,000 tonnes of contained lithium (equivalent to approximately 955,000 tonnes of LCE). The 2040 midpoint forecast of 8.5 million tonnes of LCE demand would require nearly nine times current production capacity to be built and operated within fifteen years. For context, the global copper mining industry took over a century to reach its current production capacity of approximately 22 million tonnes per year. The lithium industry is being asked to achieve a similar scale of expansion in a single decade-and-a-half.
The Lithium Supply-Demand Balance — Is There Enough?
The most commercially and strategically consequential question in the lithium market is not whether demand will grow — it will — but whether supply can grow fast enough to keep pace, and at what cost. The answer to this question has oscillated dramatically over the past five years, and the oscillations themselves reveal important structural features of the lithium market that anyone sourcing or investing in lithium needs to understand.
In 2021–2022, lithium prices surged to extraordinary heights — lithium carbonate prices in China reached approximately USD 80,000 per tonne at peak, more than twenty times their 2020 level — as battery manufacturers scrambled for supply against a demand backdrop that was growing faster than anyone had projected. Producers who had been cautious about investing in new capacity during the 2019–2020 price downturn suddenly faced a supply deficit that could not be resolved quickly because mining project development timelines (5–10 years from discovery to production) are fundamentally incompatible with the speed at which EV demand can accelerate.
In 2023–2024, the situation reversed sharply. A wave of new supply from Australian spodumene mines, Chilean brine operations, and Chinese lepidolite processing — much of it brought online in response to the 2021–2022 price spike — entered the market simultaneously. Combined with a temporary deceleration in Chinese EV demand growth in late 2023 (as government subsidies were restructured), this new supply caused lithium carbonate prices to collapse by over 80% from their peak — from USD 80,000/tonne to below USD 12,000/tonne in less than eighteen months. Many marginal-cost producers, particularly in China’s domestic lepidolite sector, became loss-making at these prices, and capital investment in new lithium projects was curtailed.
The medium-term structural outlook — looking beyond the current market cycle to the decade-long demand trajectory — remains firmly bullish for lithium. The curtailment of investment in new supply during the 2023–2024 price downturn creates the conditions for the next supply deficit, projected by most analysts to emerge in the 2027–2030 period as demand growth (driven by continued EV adoption globally) once again outpaces the supply additions that were commissioned during the downturn. This cycle of deficit-driven price spike → investment response → oversupply → price collapse → investment curtailment → new deficit is structurally embedded in the economics of hard-rock mining, and the lithium market is experiencing it at an accelerated tempo driven by the unprecedented pace of demand growth.
Geographic Distribution of Lithium Supply — The Lithium Triangle and Beyond
Current lithium production is geographically concentrated in a small number of countries, creating strategic vulnerabilities that major consuming nations are actively working to diversify away from. The global lithium supply picture is commonly summarised by reference to the “Lithium Triangle” — Chile, Argentina, and Bolivia, which collectively hold approximately 58% of the world’s known lithium resources in brine deposits — but the full global supply picture is considerably more complex, with Australia, China, Zimbabwe, and an expanding group of African nations all playing important and growing roles.
① Australia — The World’s Largest Spodumene Producer: Australia produces approximately 46% of global lithium supply, almost entirely from hard-rock spodumene mines in the Pilbara region of Western Australia — including the Greenbushes mine (Albemarle/Tianqi/IGO JV, the world’s highest-grade spodumene mine), Pilgangoora (Pilbara Minerals), Mt Marion (Mineral Resources/Jiangxi Ganfeng), and Wodgina (Albemarle/MRL). Australian spodumene is typically exported as 6% Li₂O spodumene concentrate (SC6) directly to lithium chemical converters in China — meaning that most of the value-adding chemical conversion step (spodumene → lithium hydroxide or carbonate) takes place in China rather than Australia, despite Australia holding the largest share of primary production.
② Chile — The Atacama Brine Giant: Chile produces approximately 25% of global lithium, almost entirely from brine operations in the Atacama Salar — the world’s largest and highest-grade lithium brine deposit, operated by SQM (Sociedad Química y Minera) and Albemarle. Chile’s lithium is produced as battery-grade lithium carbonate or lithium hydroxide directly at the mine site, without needing an intermediate conversion step — a cost advantage over Australian spodumene that must be converted in a separate facility. Chile’s new Lithium Strategy (2023) introduces tighter state control over lithium exploitation through CODELCO, creating some uncertainty about future production growth trajectories.
③ China — Domestic Producer and Global Processor: China produces approximately 14% of global lithium from domestic spodumene (Sichuan) and lepidolite (Jiangxi) deposits — but its role in the global lithium supply chain is far larger than its mining production share suggests. China controls approximately 58%–65% of global lithium chemical conversion capacity, processing spodumene and other lithium mineral imports from Australia, Africa, and South America into the battery-grade lithium hydroxide and lithium carbonate that cell manufacturers actually use. This processing dominance gives China structural leverage over the global lithium-to-battery supply chain far beyond what its domestic mining production share would imply.
④ Argentina — The Brine Frontier: Argentina’s portion of the Lithium Triangle — the “Puna” high-altitude salt flat region of Salta, Jujuy, and Catamarca provinces — holds some of the world’s largest lithium brine resources outside the Atacama. Several large-scale projects are in various stages of development (Livent’s Fenix project, Allkem’s Olaroz, Lithium Americas’ Cauchari-Olaroz, POSCO’s Sal de Oro), and Argentina is projected to become the world’s second-largest lithium producing country as these projects ramp to full production in the 2025–2030 period.
⑤ Zimbabwe — Africa’s Leading Lithium Producer: Zimbabwe has rapidly emerged as Africa’s most significant lithium producer, with the Arcadia Mine (Huayou Cobalt) and Bikita Minerals (Sinomine) producing spodumene concentrate from hard-rock pegmatite deposits. Zimbabwe’s 2022 raw lithium ore export ban — requiring all lithium to be converted to at least concentrate grade before export — reflects a deliberate strategy to capture more value domestically, and has reshaped the commercial structure of Zimbabwean lithium trade.
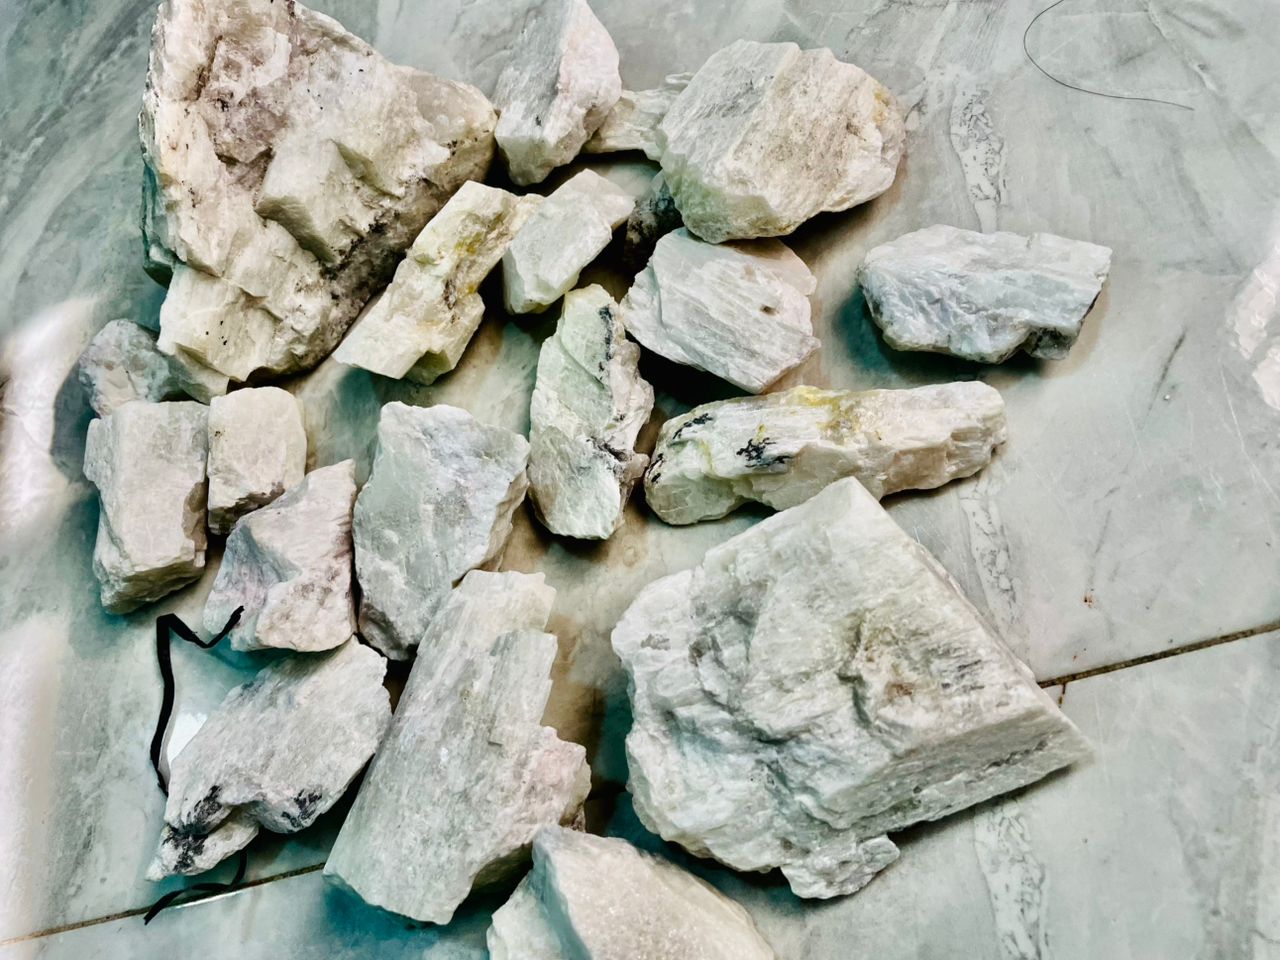
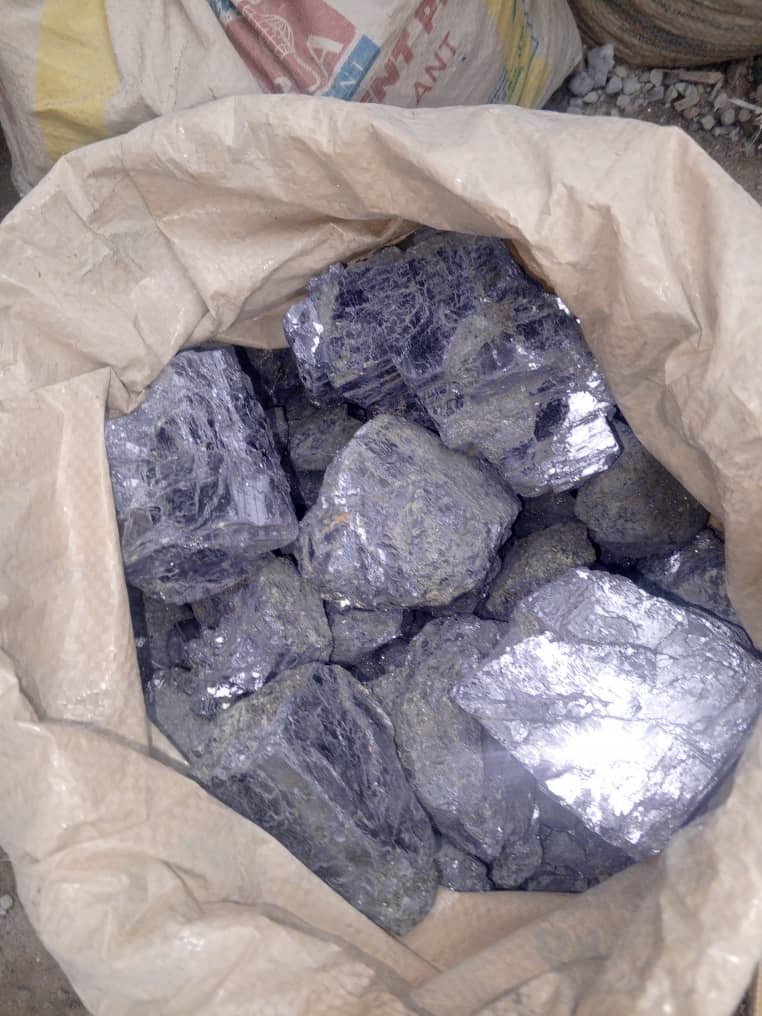
⑥ Nigeria — The West African Spodumene Frontier: Nigeria’s LCT pegmatite fields in Plateau, Nasarawa, Taraba, Kwara, Ekiti, and Zamfara States host commercially significant spodumene (Li₂O 1%–5.5%+) and lepidolite (Li₂O 1.2%–2.5%) mineralisation that is in active production through a predominantly artisanal and small-scale mining sector. Nigerian lithium ore exports have grown significantly since 2020, and Nigeria is positioned to become a meaningful contributor to global lithium mineral supply over the 2025–2035 period as production is scaled and formalised.
Nigeria’s Specific Contribution — Spodumene and Lepidolite for the Global EV Supply Chain
Nigeria’s contribution to the global EV lithium supply chain flows through two primary mineral types: spodumene (LiAlSi₂O₆) — the dominant commercial lithium mineral in hard-rock pegmatite deposits globally — and lepidolite (K(Li,Al)₃(Al,Si)₄O₁₀(OH,F)₂) — a lithium-bearing mica that is less commonly produced but commercially significant for specific processing routes and grades. Both minerals occur across multiple Nigerian states, with the highest concentrations in the LCT (Lithium-Caesium-Tantalum) pegmatite fields of Plateau State and the surrounding states of north-central and southwestern Nigeria.
| State | Key Production Areas | Lithium Mineral | Li₂O Range | Commercial Status |
|---|---|---|---|---|
| Plateau State | Jos North, Jos South, Bassa, Bukuru, Mangu LGA | Spodumene (kunzite variety) | 1.0%–5.5%+ | Most active; largest ASM and SSML lithium sector in Nigeria; established mineral market in Jos |
| Nasarawa State | Nasarawa–Eggon LGA, Obi LGA, Keana | Spodumene | 0.8%–4.0% | Growing; seasonal production peak in dry season; integrated with Plateau State supply network |
| Taraba State | Mambilla Plateau (Sardauna LGA), Zing LGA | Spodumene | 1.0%–3.5% | Remote; early commercial stage; logistics challenge limits current volumes; high future potential |
| Edo State | Auchi (Etsako West LGA), Akoko-Edo | Lepidolite | 1.2%–2.5% | Active; supply coordinated through Rahim Momoh (Rahimmomoh1234@gmail.com); priced at ₦150k–₦230k/MT EXW Auchi depending on grade |
| Kwara State | Ijero-Ekiti border area; Ilorin environs | Spodumene, Lepidolite | 0.8%–3.0% | Active small-scale; growing output; basement complex pegmatite setting |
| Ekiti State | Ado-Ekiti environs, Ijero-Ekiti, Ikole LGA | Spodumene, Lepidolite | 0.8%–2.5% | Active; artisanal mining ongoing in basement complex pegmatites |
| Zamfara State | Birnin Gwari corridor (Kaduna/Zamfara border) | Spodumene (emerging) | 0.5%–2.0% | Emerging; security challenges limit access; prospectivity confirmed by geological surveys |
Augustina Impex Limited aggregates lithium ore from across this multi-state supply network — coordinating production from both individual SSML licence holders and community-based artisanal mining groups — and manages the quality assessment, pre-shipment inspection coordination, export documentation, and international logistics that convert Nigeria’s distributed artisanal lithium production into verified, documented export-grade ore consignments that meet the commercial standards required by international buyers. Our minimum order quantity for lithium ore export is 50 MT for trial shipments and 100 MT+ for ongoing commercial supply. Grade, packaging, incoterms, and pricing are specified in our Soft Corporate Offer (SCO) upon receipt of buyer specifications.
The Technology Wild Cards — What Could Change the Lithium Demand Equation?
No discussion of future lithium demand for EVs would be complete without honestly addressing the technology wild cards — the emerging battery technologies, alternative chemistries, and recycling developments that could materially change the lithium intensity of the EV fleet and therefore the ultimate scale of primary lithium demand. These should be understood as factors that add uncertainty to the demand projections presented above, not as factors that negate the fundamental bullish trajectory.
① All-Solid-State Batteries (ASSB): Solid-state batteries replace the liquid electrolyte in current lithium-ion cells with a solid ionic conductor — enabling the use of a lithium metal anode (instead of graphite) that stores far more lithium per unit volume, and enabling thinner, lighter electrolyte layers that improve energy density. The net effect of the lithium metal anode in ASSB is to reduce the lithium required per kWh of battery capacity by approximately 20%–30% compared to current graphite-anode LIBs, because metallic lithium has much higher volumetric and gravimetric capacity than graphite. Toyota, Samsung SDI, and QuantumScape are targeting commercial ASSB production from approximately 2027–2030 in niche EV applications, scaling to mainstream by 2032–2035. This technology — if it arrives on schedule and at cost — would moderate (though not eliminate) lithium demand growth per kWh.
② Sodium-Ion Batteries (Na-ion): CATL and BYD have both announced sodium-ion battery products targeting short-range, cost-sensitive EV applications — particularly small city cars in China where range requirements are modest and price sensitivity is extreme. Na-ion batteries contain no lithium whatsoever, potentially displacing lithium demand in the entry-level EV segment. However, Na-ion’s lower energy density (approximately 130–160 Wh/kg vs. 200–260 Wh/kg for NMC lithium-ion) limits it to applications where size and weight are not constraining — predominantly small city EVs and grid storage applications. Even aggressive Na-ion adoption scenarios suggest it captures at most 10%–15% of the EV market by 2030, primarily displacing LFP rather than high-density NMC.
③ Battery Recycling and Lithium Recovery: As the global EV fleet ages, the lithium in spent EV batteries represents a growing secondary lithium resource. Efficient recycling of lithium from spent batteries — using hydrometallurgical (acid leaching) or direct recycling processes — could supply a significant proportion of future lithium demand from secondary rather than primary sources. Benchmark Mineral Intelligence projects that recycled lithium could supply 5%–10% of total demand by 2030 and potentially 20%–25% by 2040 as the EV fleet reaches end-of-life in volume. This is a meaningful future contribution, but at current recycling rates and economics it does not materially affect the near-to-medium term (2025–2030) supply picture.
Policy Drivers Accelerating the Transition — IRA, EU Battery Regulation, and Beyond
The EV transition is not purely market-driven — it is also policy-accelerated, with government interventions in every major economy creating demand pull, supply incentives, and supply chain localization requirements that are reshaping the lithium industry’s development trajectory. Three policy frameworks in particular are reshaping the commercial structure of the lithium supply chain in ways that are directly relevant to Nigerian lithium producers and exporters.
① US Inflation Reduction Act (IRA) — Localising the Battery Supply Chain: The IRA’s EV tax credits (up to $7,500 per vehicle) are conditioned on a progressive increase in the proportion of battery minerals sourced from the US or from countries with qualifying trade agreements (FTAs or Critical Minerals Agreements, CMAs). The percentage of battery mineral value that must be sourced from qualifying countries increases from 40% in 2023 to 80% by 2027. This requirement is directly creating commercial demand for lithium from non-Chinese, politically aligned sources — and is the primary commercial mechanism pushing US battery supply chain actors to source Nigerian, Australian, Chilean, and Canadian lithium rather than relying exclusively on Chinese-processed material. Nigeria does not currently have a CMA with the United States, but US-Nigeria mineral sector engagement is a stated priority of US Africa policy frameworks.
② EU Battery Regulation (2023) — Traceability and Carbon Footprint Requirements: The EU Battery Regulation requires battery manufacturers selling into the European market to meet progressive requirements for battery mineral traceability (chain of custody documentation from mine to cell), carbon footprint declaration (and eventually a maximum carbon footprint threshold), and minimum recycled content (including recycled lithium content targets). These requirements create commercial demand for documented, traceable battery mineral supply — which Nigerian lithium producers who work with formalised, SSML-licensed operations and pre-shipment inspection by CCIC, SGS, or Bureau Veritas are better positioned to provide than purely informal artisanal supply.
③ The EU Critical Raw Materials Act and Strategic Partnerships: The EU CRMA sets a benchmark that the EU should source no more than 65% of any critical raw material (including lithium) from a single third country, and establish strategic partnerships with multiple producing nations to ensure supply diversification. This policy directly supports EU engagement with African lithium producers as part of a deliberate supply chain diversification strategy — and Nigeria, with its diversified mineral portfolio, ECOWAS membership, and English-language commercial infrastructure, is a natural candidate for EU strategic minerals partnership engagement.
What This Means for Nigerian Lithium Miners and Exporters
For the Nigerian lithium sector — miners, aggregators, and export companies — the future demand picture for lithium in electric vehicles creates both extraordinary opportunity and concrete commercial requirements that must be met to realise that opportunity. The opportunity is real and structural: a multi-decade demand surge for the mineral that Nigeria’s soil produces in abundance, at prices that make development commercially compelling, from buyers who are actively seeking to diversify away from Chinese-controlled supply chains. The requirements are equally real: formalised operations (SSML licences), documented supply chains (PSI-inspected, laboratory-assayed), reliable volume (supply contracts rather than spot transactions), and compliance-grade documentation (NEPC registration, export certificates, chain of custody).
Augustina Impex Limited is built specifically to bridge the gap between Nigeria’s raw artisanal production capacity and the commercial standards required by international lithium buyers who are sourcing for EV battery supply chains. We provide the aggregation, quality assessment, PSI coordination, regulatory documentation, and international buyer relationships that convert Nigeria’s distributed lithium ore production into verified, commercially viable export supply. The future of lithium demand runs through Nigeria. The question is whether Nigerian supply is organised well enough to capture it — and building that organisation, one supply relationship at a time, is the core of what Augustina Impex does.
Frequently Asked Questions — Future Lithium Demand for EVs
The Earth’s lithium resources — the total quantity of lithium in known and estimated geological deposits — are sufficient to electrify the global vehicle fleet several times over. The USGS estimates identified global lithium resources at approximately 98 million tonnes of lithium metal (as of 2024), with probable additional resources raising the total to potentially 300–400 million tonnes. Fully electrifying the entire current global vehicle fleet of approximately 1.4 billion vehicles would require approximately 18–20 million tonnes of lithium metal in total battery capacity. The resources exist. The question is not geological sufficiency but economic and logistical — whether the right mix of capital, processing technology, infrastructure, and supply chain organisation can convert lithium resources into commercially mined and processed lithium products at the pace and price that the EV transition requires.
The 2023–2024 lithium price crash illustrates the fundamental asymmetry between the speed of EV demand growth and the speed of lithium supply response. The 2021–2022 price spike attracted enormous capital into new supply projects, many of which came online simultaneously in 2023 — just as Chinese EV demand growth decelerated temporarily (as government subsidies were restructured), creating a supply surplus against a temporarily slower-growing demand base. This combination of supply surge and demand deceleration overwhelmed the market. However, the underlying long-term demand growth trajectory has not changed — it is structural, policy-driven, and embedded in multi-decade commitments by governments and manufacturers. Most analysts project that the supply added during the 2021–2023 investment wave will be absorbed by demand growth by 2027–2029, setting the stage for the next supply deficit cycle.
No — sodium-ion batteries will not make lithium obsolete for EVs within any commercially relevant timeframe. Na-ion batteries have fundamental electrochemical limitations — lower energy density, lower cell voltage, and lower volumetric efficiency than lithium-ion — that confine them to applications where size and weight are not constraining and where the lowest possible cost per kWh is the primary requirement (short-range city cars, grid storage). They cannot power long-range EVs, SUVs, or commercial vehicles where energy density is critical, and they are competing with LFP (not NMC) in the market segments they can address. The more accurate picture is that Na-ion will capture a modest share of the EV market’s low-end segment by 2027–2030, modestly reducing lithium demand growth at the margin — but not altering the fundamental trajectory of massively growing lithium demand driven by the transition to EVs across all vehicle segments globally.
Nigerian spodumene ore at Li₂O grades of 1.5% and above is suitable as feedstock for spodumene concentrate production — which is the standard commercial form in which lithium ore is sold to lithium chemical converters globally. The typical commercial specification for spodumene concentrate (SC6) is 5.5%–6.0% Li₂O after beneficiation (crushing, heavy media separation or froth flotation, and magnetic separation to remove iron minerals). Higher-grade run-of-mine ore (3%–5.5%+ Li₂O) from Nigerian pegmatite fields can be beneficiated more economically and with higher recovery rates to SC6 grade. Lower-grade ore (1%–2% Li₂O) requires more aggressive beneficiation and generates more tailings waste per tonne of concentrate produced, but is still commercially viable at sufficient volume. Lepidolite from Edo State (Li₂O 1.2%–2.5%) is processed differently from spodumene — typically by acid roasting or direct pressure leaching — and is acceptable to Chinese lithium chemical plants that operate lepidolite circuits, of which there are several in Jiangxi Province.
The most efficient path to verified Nigerian lithium supply is through engagement with NEPC-registered export companies with established field supply networks, quality control capabilities, and PSI coordination partnerships. Augustina Impex Limited (NEPC RE No. 0039421) operates precisely this model — aggregating lithium ore (spodumene and lepidolite) from a multi-state supply network across Plateau, Nasarawa, Taraba, Kwara, Ekiti, and Edo States; coordinating pre-shipment quality inspection by CCIC, SGS, or Bureau Veritas; and managing the complete export documentation package. Minimum trial order is 50 MT. Ongoing commercial supply from 100 MT/month. To receive a Soft Corporate Offer specifying available grades, current indicative pricing, and commercial terms, contact us at augustinaimpex@gmail.com or WhatsApp +234 906 090 4274.
Augustina Impex Limited is your NEPC-registered Nigerian lithium ore supplier — connecting spodumene and lepidolite from seven producing states to qualified international buyers, with PSI inspection, full export documentation, and transparent commercial terms.
📧 augustinaimpex@gmail.com | 📞 WhatsApp: +234 906 090 4274
Kolawole King is the Chief Executive Officer of Augustina Impex Limited (RC 750691), a NEPC-registered Nigerian solid minerals export company headquartered in Jos, Plateau State, Nigeria. With a supply network spanning seven lithium-producing states and direct field relationships with artisanal and SSML-licensed miners, Augustina Impex is one of Nigeria’s most commercially organised lithium ore aggregators and export companies. Visit www.augustinaimpex.com or the corporate blog at augustinaimpexng.blogspot.com.
-
Previous Post
Why Titanium Is Critical to Aerospace & Renewables
-
Next Post
Top Industrial Uses of Zircon Sand
Post a comment
Related Posts
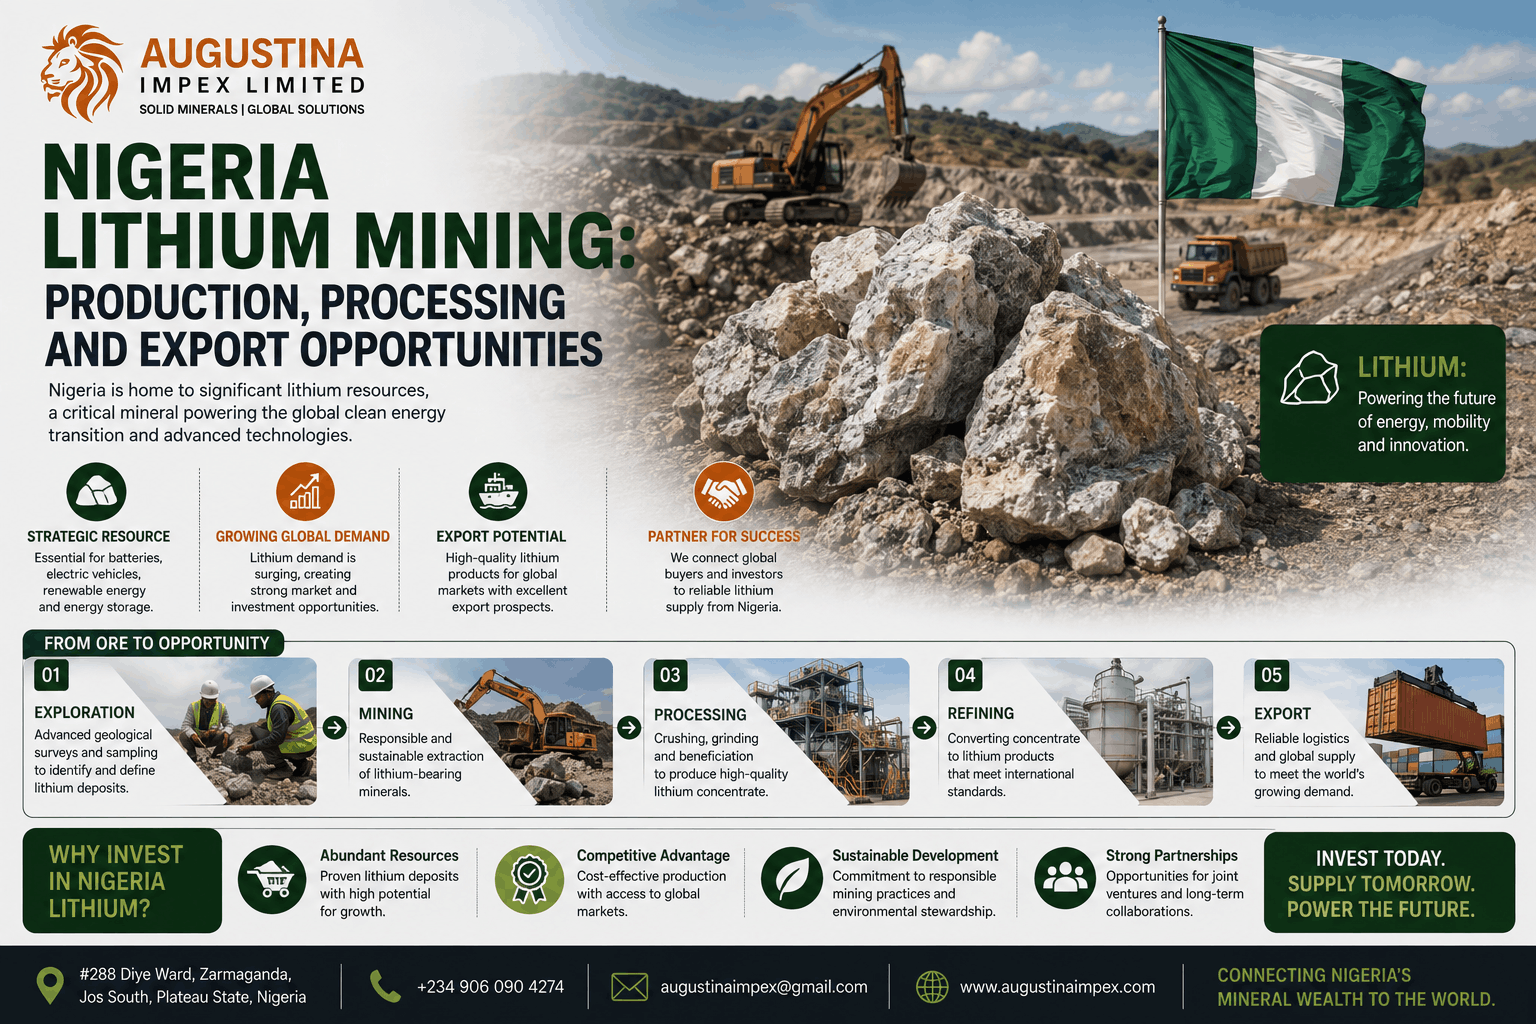
Nigeria Lithium Mining: Production, Processing & Export
Nigeria Lithium Mining: Production, Processing and Export Opportunities By Kolawole King, CEO — Augustina Impex…
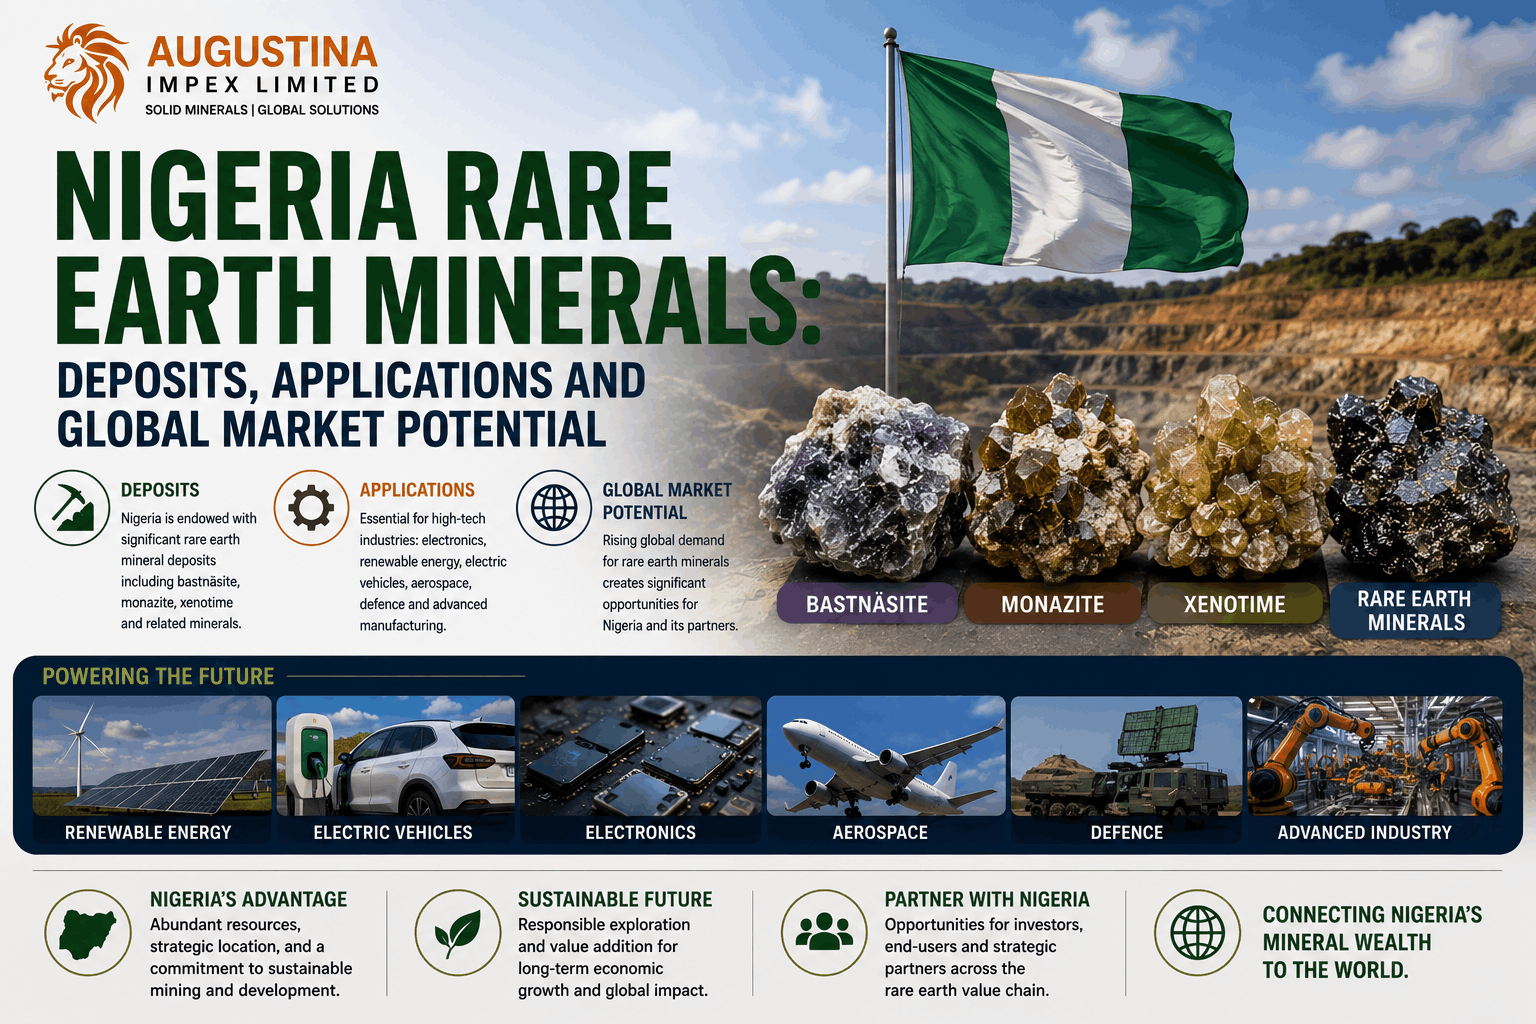
Nigeria Rare Earth Minerals: Deposits & Market Potential
Nigeria Rare Earth Minerals: Deposits, Applications and Global Market Potential By Kolawole King, CEO —…
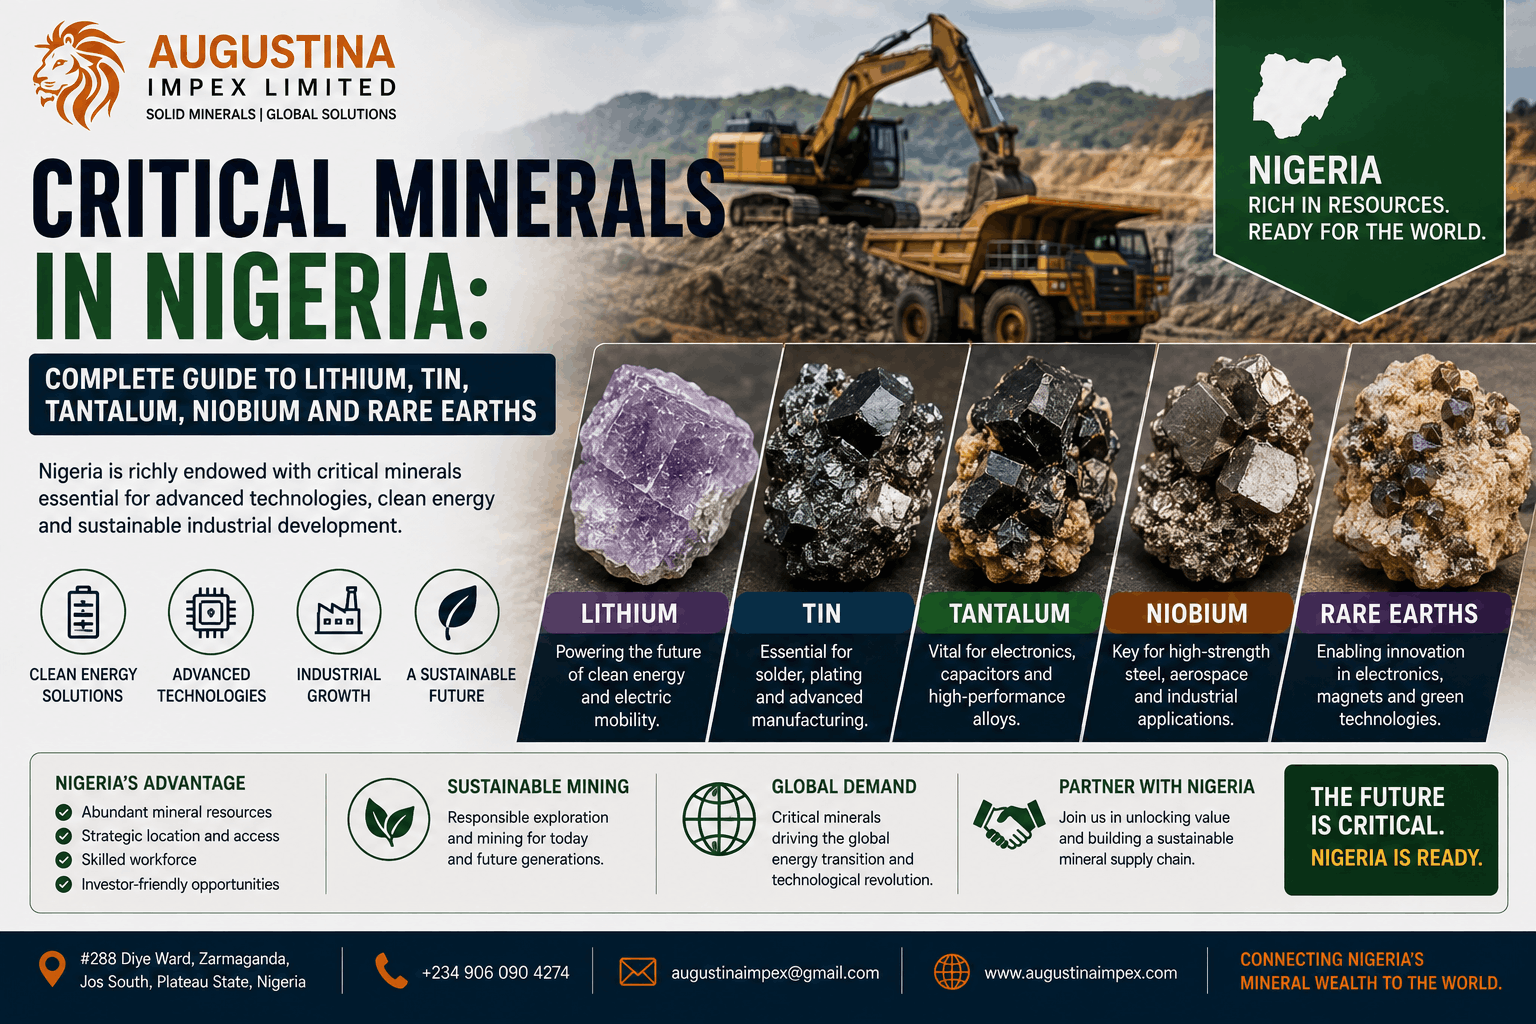
Nigeria Critical Minerals Guide: Lithium, Tin & Rare Earths
Critical Minerals in Nigeria: Complete Guide to Lithium, Tin, Tantalum, Niobium and Rare Earths By…
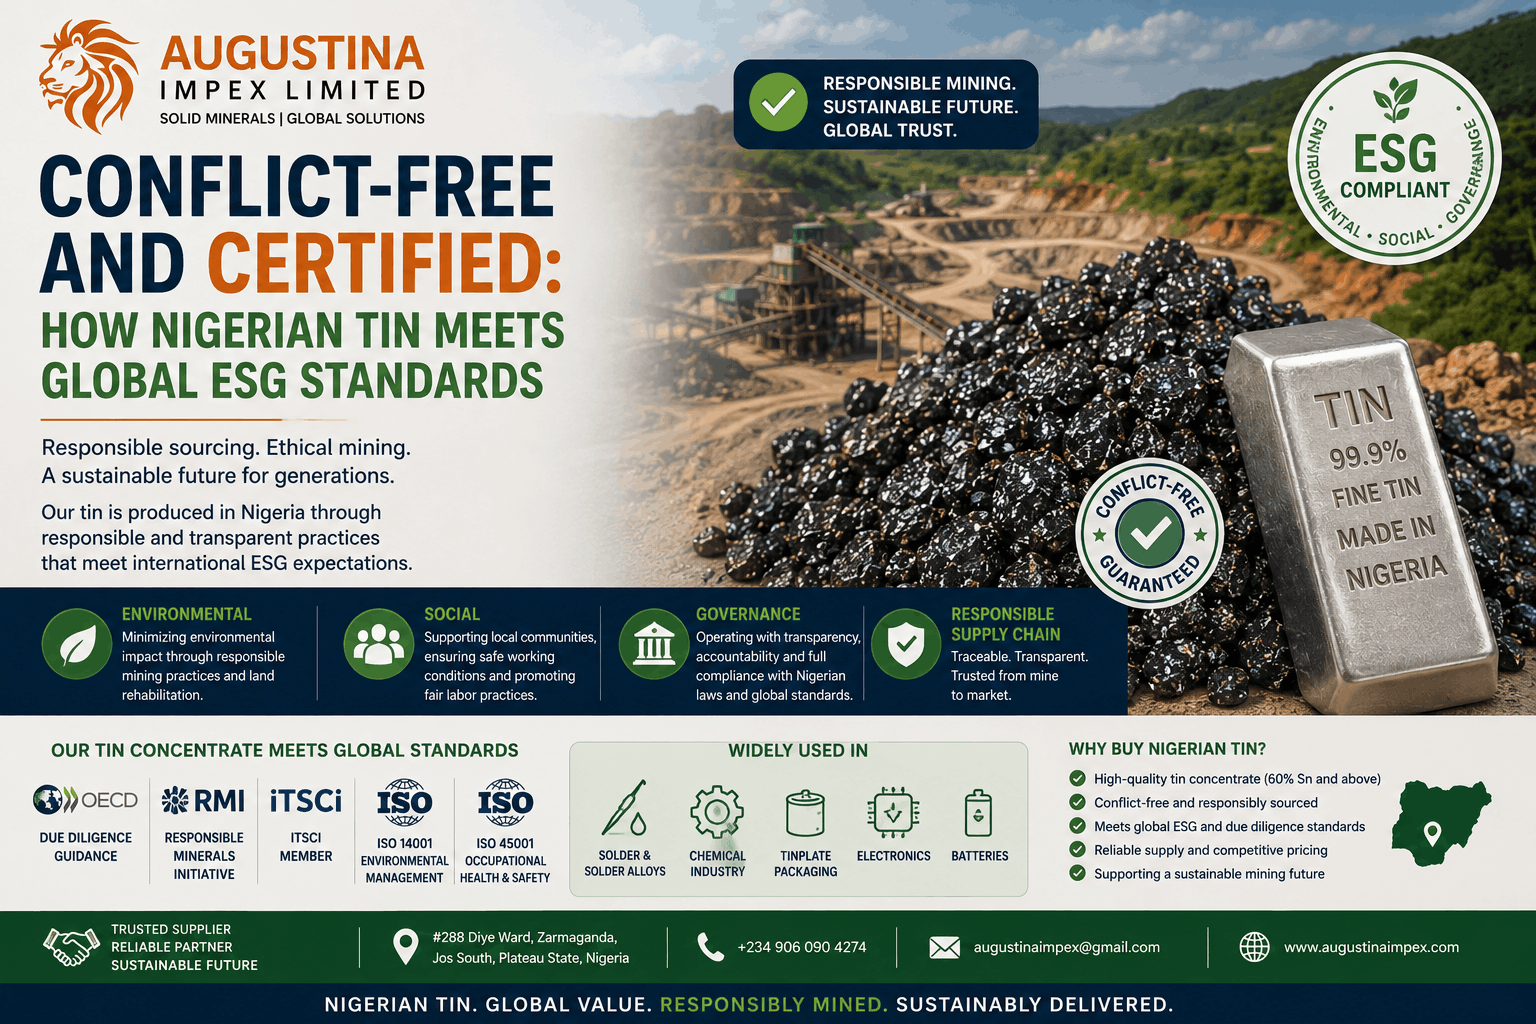
Conflict-Free Nigerian Tin Meets Global ESG Standards
Conflict-Free and Certified: How Nigerian Tin Meets Global ESG Standards By Kolawole King, CEO —…